GY-DAQ-2480 Data Analysis and Sample Code for Capture Cards (Python)
2026-06-16 08:15:33
Keywords:
GY-DAQ-2480
Data Analysis
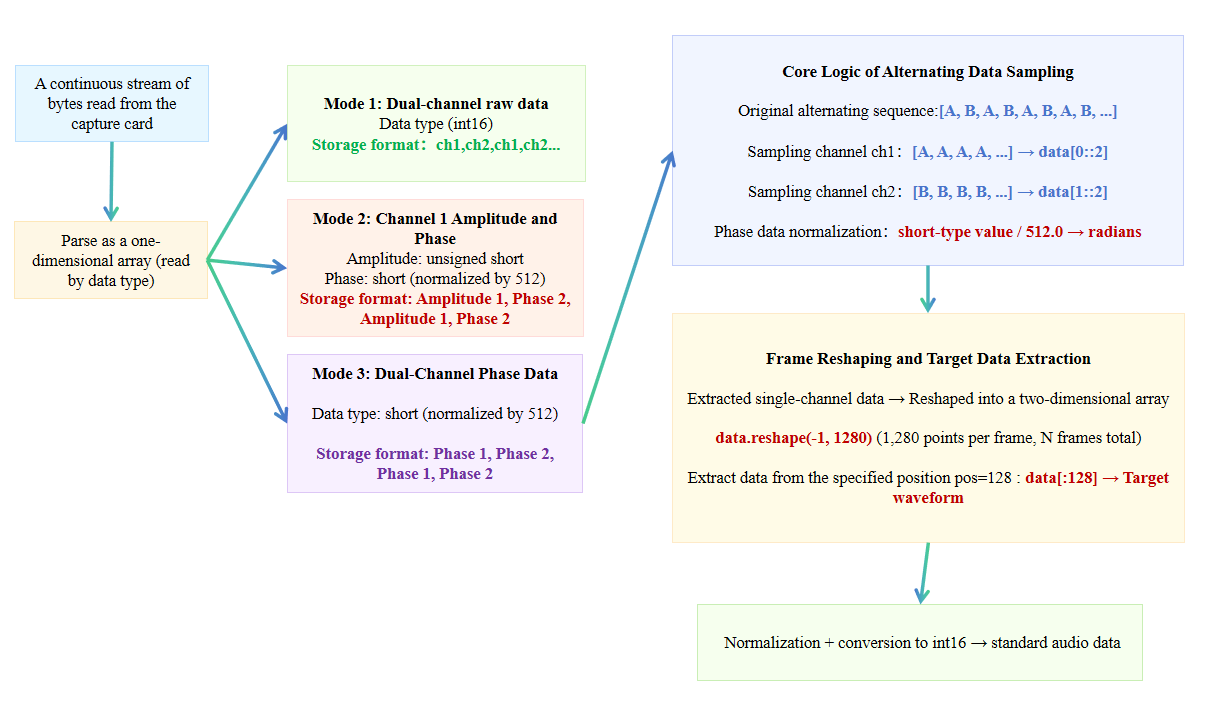
Flowchart of the Data Analysis Process for a Capture Card
Some data acquisition cards use the UDP network protocol, while others have a PCIe interface. Therefore, there may be slight differences in how each card reads continuous byte streams. The logical process for parsing DAS data is essentially the same; the following explanation uses the GY-DAQ-2480 card as an example.
Sample Code (Python)
- The output data from the acquisition card is stored in an alternating pattern:
sel=1 (dual-channel raw data): ch1, ch2, ch1, ch2, ...
sel=2 (channel 1 amplitude and phase): amplitude1, phase1, amplitude1, phase1, ...
sel=3 (dual-channel phase data): phase1, phase2, phase1, phase2, ...
- Data types:
Raw / Phase: short (signed 16-bit)
Amplitude: unsigned short (unsigned 16-bit)
- Phase data must be normalized by dividing by 512.0 to obtain radians; it can also be used directly as audio.
import numpy as np
import matplotlib.pyplot as plt
import os
import wave

# ========== 1. Configuration Parameters ==========
samples_per_frame = 2560   # Number of samples per frame (your previous configuration)
sel_mode = 3               # Sound card mode: 1/2/3; adjust according to the mode actually used
play_rate = 20000          # Audio sample rate; must match the sound card
file_name = ‘2026-03-06_10-41-36.bin’  # The name of your .bin file as saved by the sound card.

# Get the script path
current_dir = os.path.dirname(os.path.abspath(__file__))
file_path = os.path.join(current_dir, file_name)

# ========== 2. Read raw binary data ==========
with open(file_path, ‘rb’) as f:
    buffer = f.read()

# ========== 3. Parse data based on sel_mode ==========
if sel_mode == 1:
    # Mode 1: Dual-channel raw data, stored alternately: ch1, ch2, ch1, ch2...
    data = np.frombuffer(buffer, dtype=np.int16)  # Raw data is of type short
    ch1 = data[0::2]  # Take even indices (0, 2, 4, ...)
    ch2 = data[1::2]  # Take odd indices (1, 3, 5, ...)
    print(f“Mode 1 parsing complete: ch1 length={len(ch1)}, ch2 length={len(ch2)}”)

elif sel_mode == 2:
    # Mode 2: Channel 1 amplitude and phase, stored alternately: amplitude 1, phase 1, amplitude 1, phase 1...
    data_u16 = np.frombuffer(buffer, dtype=np.uint16)  # Amplitude is unsigned short
    data_i16 = np.frombuffer(buffer, dtype=np.int16)   # Phase is short
    amp1 = data_u16[0::2]  # Amplitude: even indices
    phase1 = data_i16[1::2] / 512.0  # Phase: odd indices, divided by 512 to normalize to radians
    print(f“Mode 2 analysis complete: amp1 length={len(amp1)}, phase1 length={len(phase1)}”)
elif sel_mode == 3:
    # Mode 3: Dual-channel phase data, stored alternately: phase1, phase2, phase1, phase2...
    data = np.frombuffer(buffer, dtype=np.int16)
    phase1 = data[0::2] / 512.0  # Channel 1 phase
    phase2 = data[1::2] / 512.0  # Channel 2 phase
    print(f“Mode 3 parsing complete: phase1 length={len(phase1)}, phase2 length={len(phase2)}”)

else:
    raise ValueError(“sel_mode must be 1/2/3”)

# ========== 4. Extract data from a specified frame position (corresponding to your previous pos=128) ==========
# Using mode 1 as an example, extract the column at pos=128 from ch1 (aligning with your previous logic)
pos = 128  # The playback position you set previously
if sel_mode == 1:
    # Reshape to [frame number, number of samples per frame / 2], since each frame alternates between ch1 and ch2
    # Note: samples_per_frame is the total number of samples per frame (including ch1 and ch2)
    ch1_frames = ch1.reshape(-1, samples_per_frame // 2)
    # Custom demodulation code.....

elif sel_mode == 3:
    # Mode 3: Extract the 128th column of phase1 (phase data is used directly as audio)
    phase1_frames = phase1.reshape(-1, samples_per_frame // 2)
    phase1_pos_data = phase1_frames[:, pos]
    s_normalized = phase1_pos_data / np.max(np.abs(phase1_pos_data))
    audio_int16 = (s_normalized * 32767).astype(np.int16)

# ========== 5. Save as a WAV file (optional) ==========
def save_wave(filename, data, rate):
    with wave.open(filename, ‘wb’) as wf:
        wf.setnchannels(1)        # Mono
        wf.setsampwidth(2)       # 16-bit
        wf.setframerate(rate)    # Sampling rate
        wf.writeframes(data.tobytes())

# Example: Save the extracted audio
if ‘audio_int16’ in locals():
    save_wave(‘output.wav’, audio_int16, play_rate)
    print(“Audio saved as output.wav”)
# ========== 6. Plotting the Waveform (Optional) ==========
plt.figure(figsize=(12, 4))
if sel_mode == 1:
    plt.plot(ch1_pos_data, label=‘ch1 pos=128’)
elif sel_mode == 3:
    plt.plot(phase1_pos_data, label=‘phase1 pos=128’)
plt.legend()
plt.title(“Extracted Waveforms”)
plt.show()
Related Content
- Capture Card Testing Software
- Ethernet Port Data Acquisition Card Installation Guide
- Installation Guide for PCIe DAS Acquisition Cards
- GY-DAQ-2510D API Documentation
- DVS-ETH-100-2 API Documentation
- DAS Data Acquisition Card Driver Installation Guide
- GY-DAQA-2510 API Documentation
- Should I choose a 250 MHz or 1 GHz data acquisition card for a DAS system?