DAQ50 Dual-Channel Continuous Data Acquisition Card
The DAQ50 is a continuous acquisition card that operates at a sampling rate of 50 M when one channel is enabled and 25 M when two channels are enabled, making it suitable for photodetection applications.
 Huang
Email: Hqy@ybphotonics.com
Huang
Email: Hqy@ybphotonics.com
1. Overview
The DAQ50 is a dual-channel synchronous data acquisition card that uses a Gigabit Ethernet port for data transmission. It offers a maximum sampling rate of 50 MHz and is very easy to use.
1.5. API Documentation And Software Downloads
2. Specifications
- 14-bit dual-channel synchronous real-time acquisition
- Configurable number of channels (1 channel: 50 MHz sampling rate; 2 channels: 25 MHz sampling rate)
- DC-coupled
- ±5.0V input range (customizable)
- Gigabit Ethernet port, UDP protocol
- 12V/0.3A power supply
- Operating temperature range: -20 to 60°C
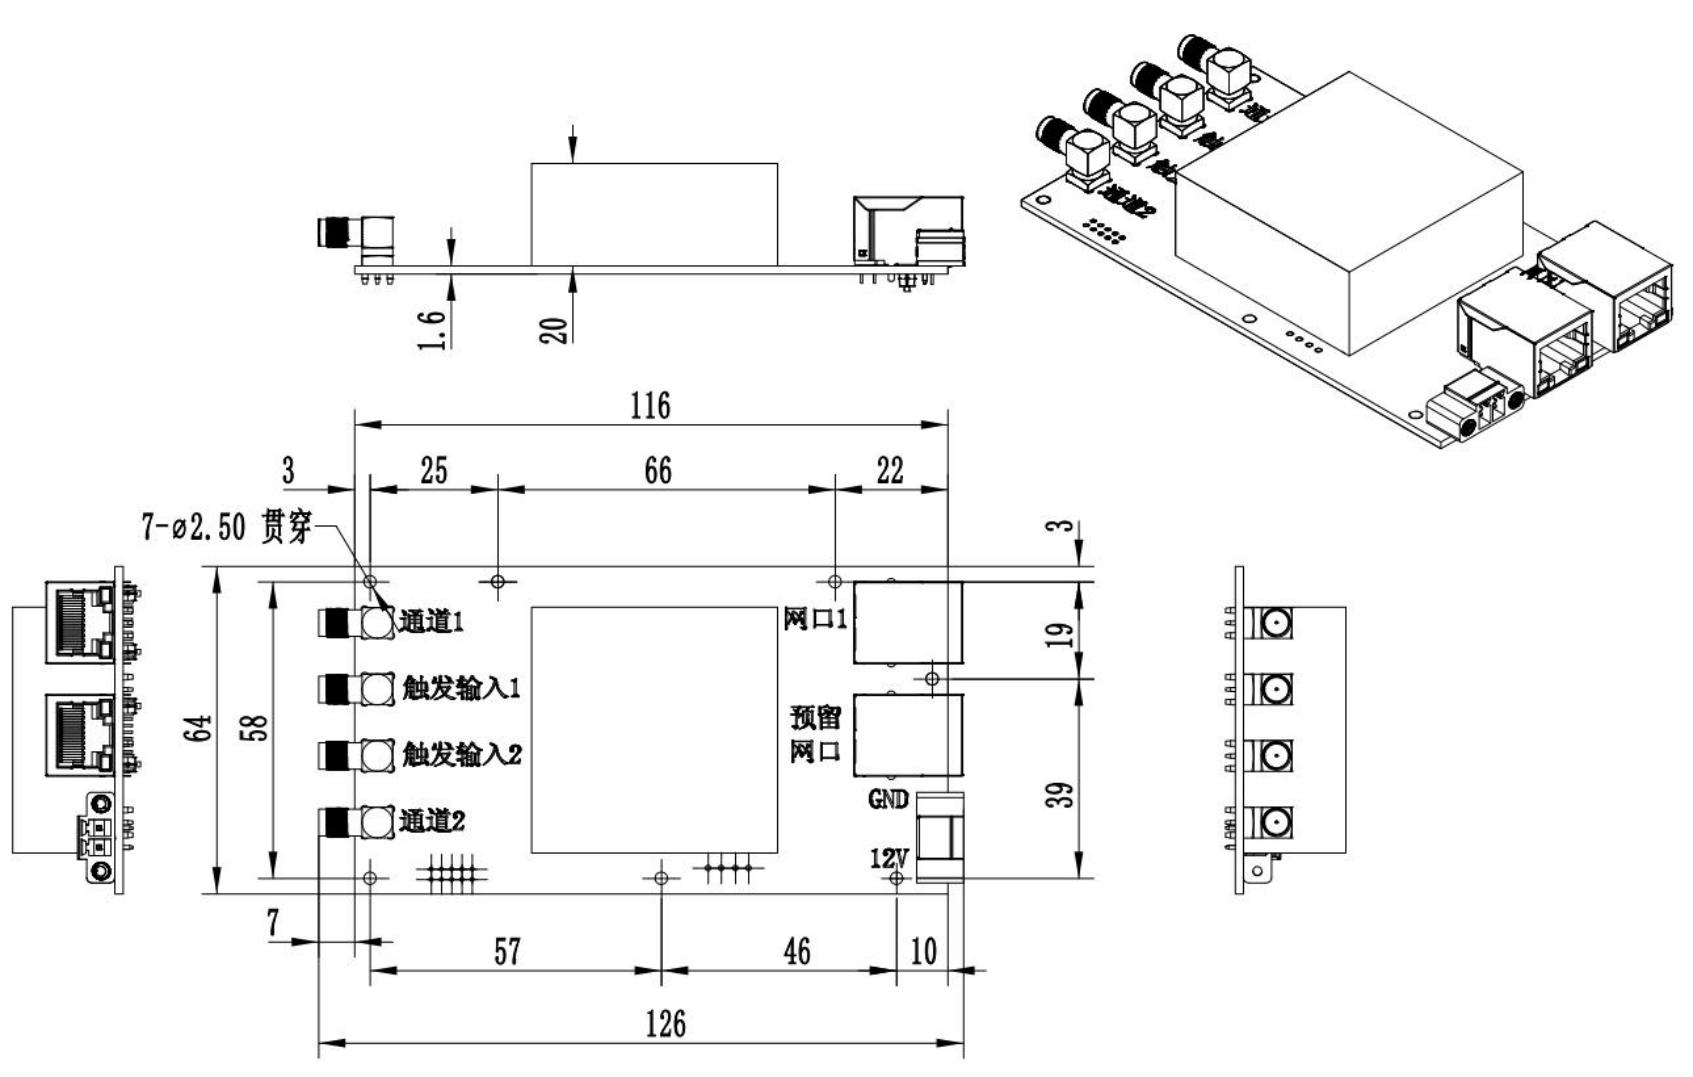
3. Dimension Drawing
4. Workflow
UDP communication is used. The data acquisition card’s IP address is 192.168.137.2, and the port is 8028. The workflow is as follows:
1. Set the number of ADC channels on the data acquisition card (1 channel or 2 channels)
2. Set the data acquisition card to start sampling (after the setting is successful, continuously receive data actively uploaded by the data acquisition card)
3. Set the data acquisition card to stop sampling
5.Software Debugging Examples
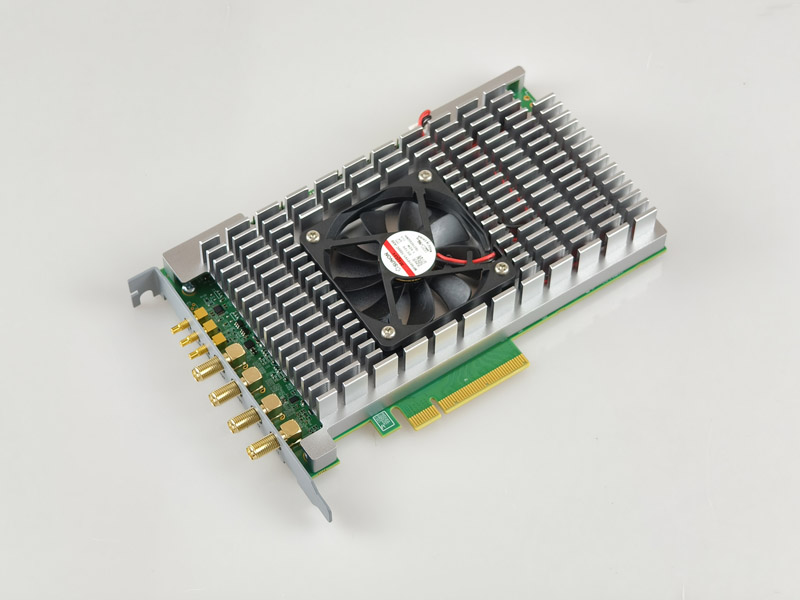
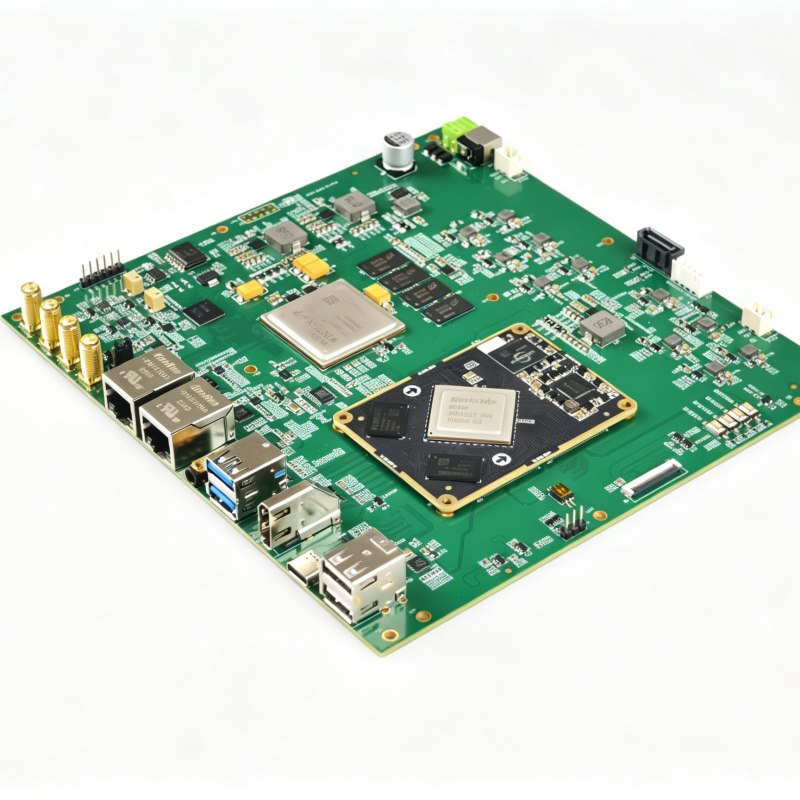
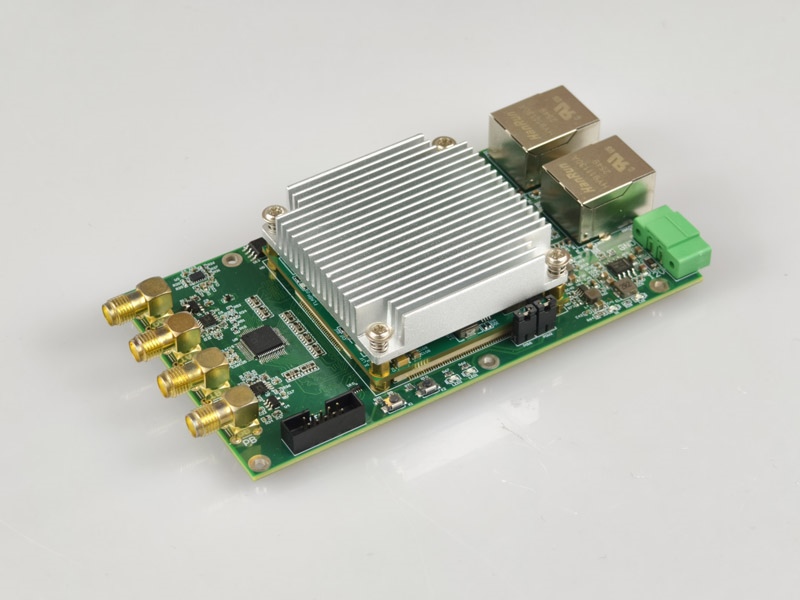
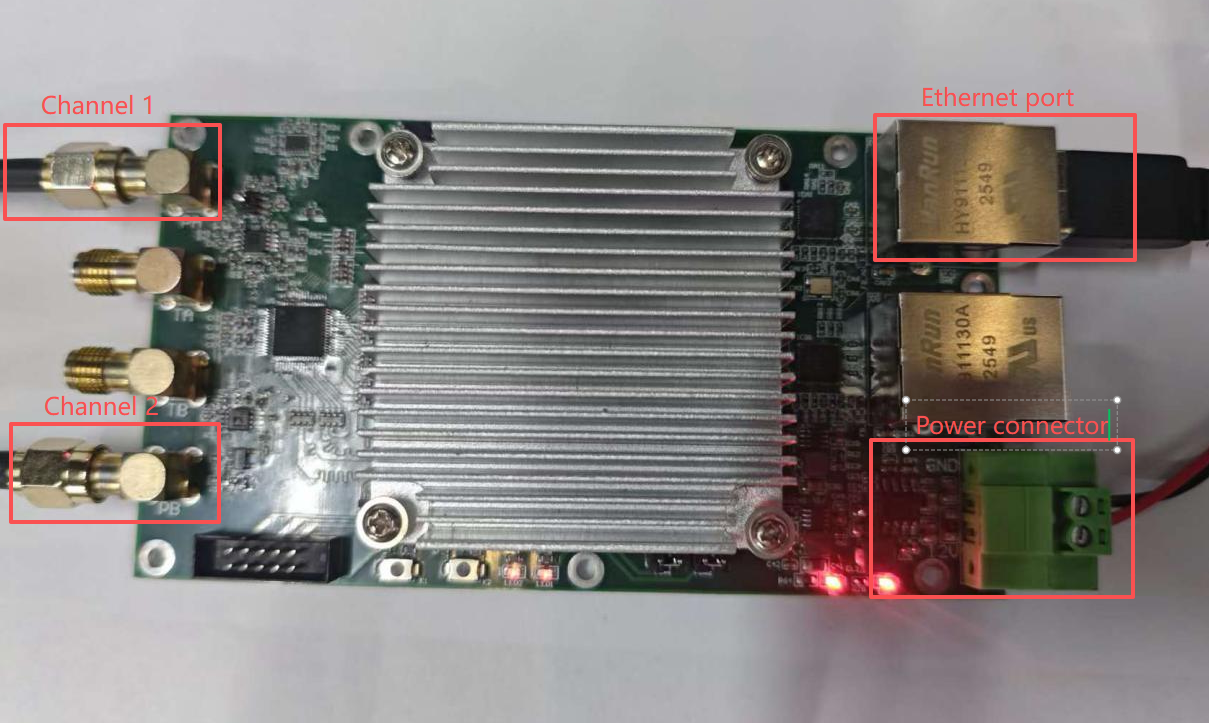
First, connect the acquisition card as shown in the figure below. Connect the external signals to channels 1 and 2 of the acquisition card using SMA RF cables. Connect the power connector to a 12V power supply, and connect Ethernet port 1 to the computer using an Ethernet cable:
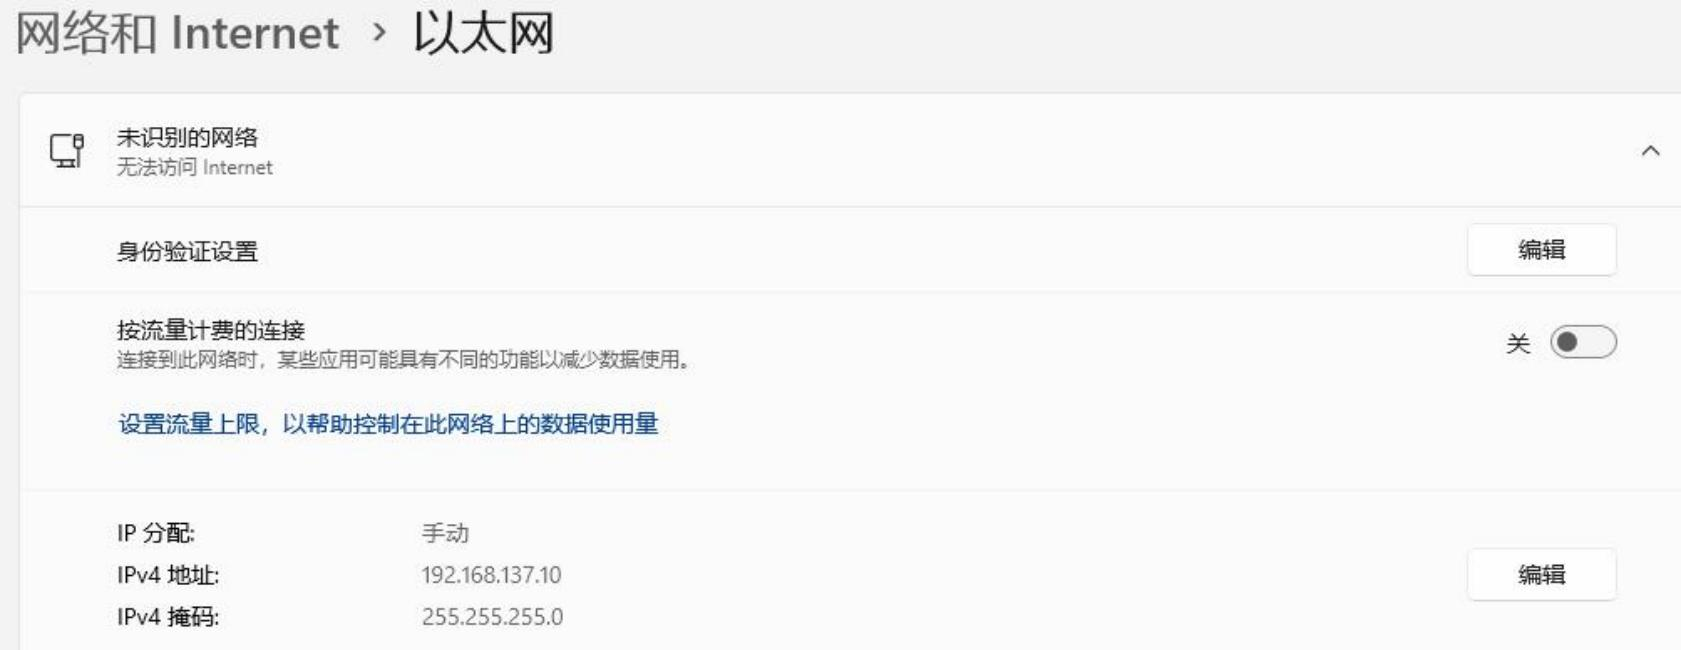
1. Set your computer's IP address to 192.168.137.10, as shown in the figure below:
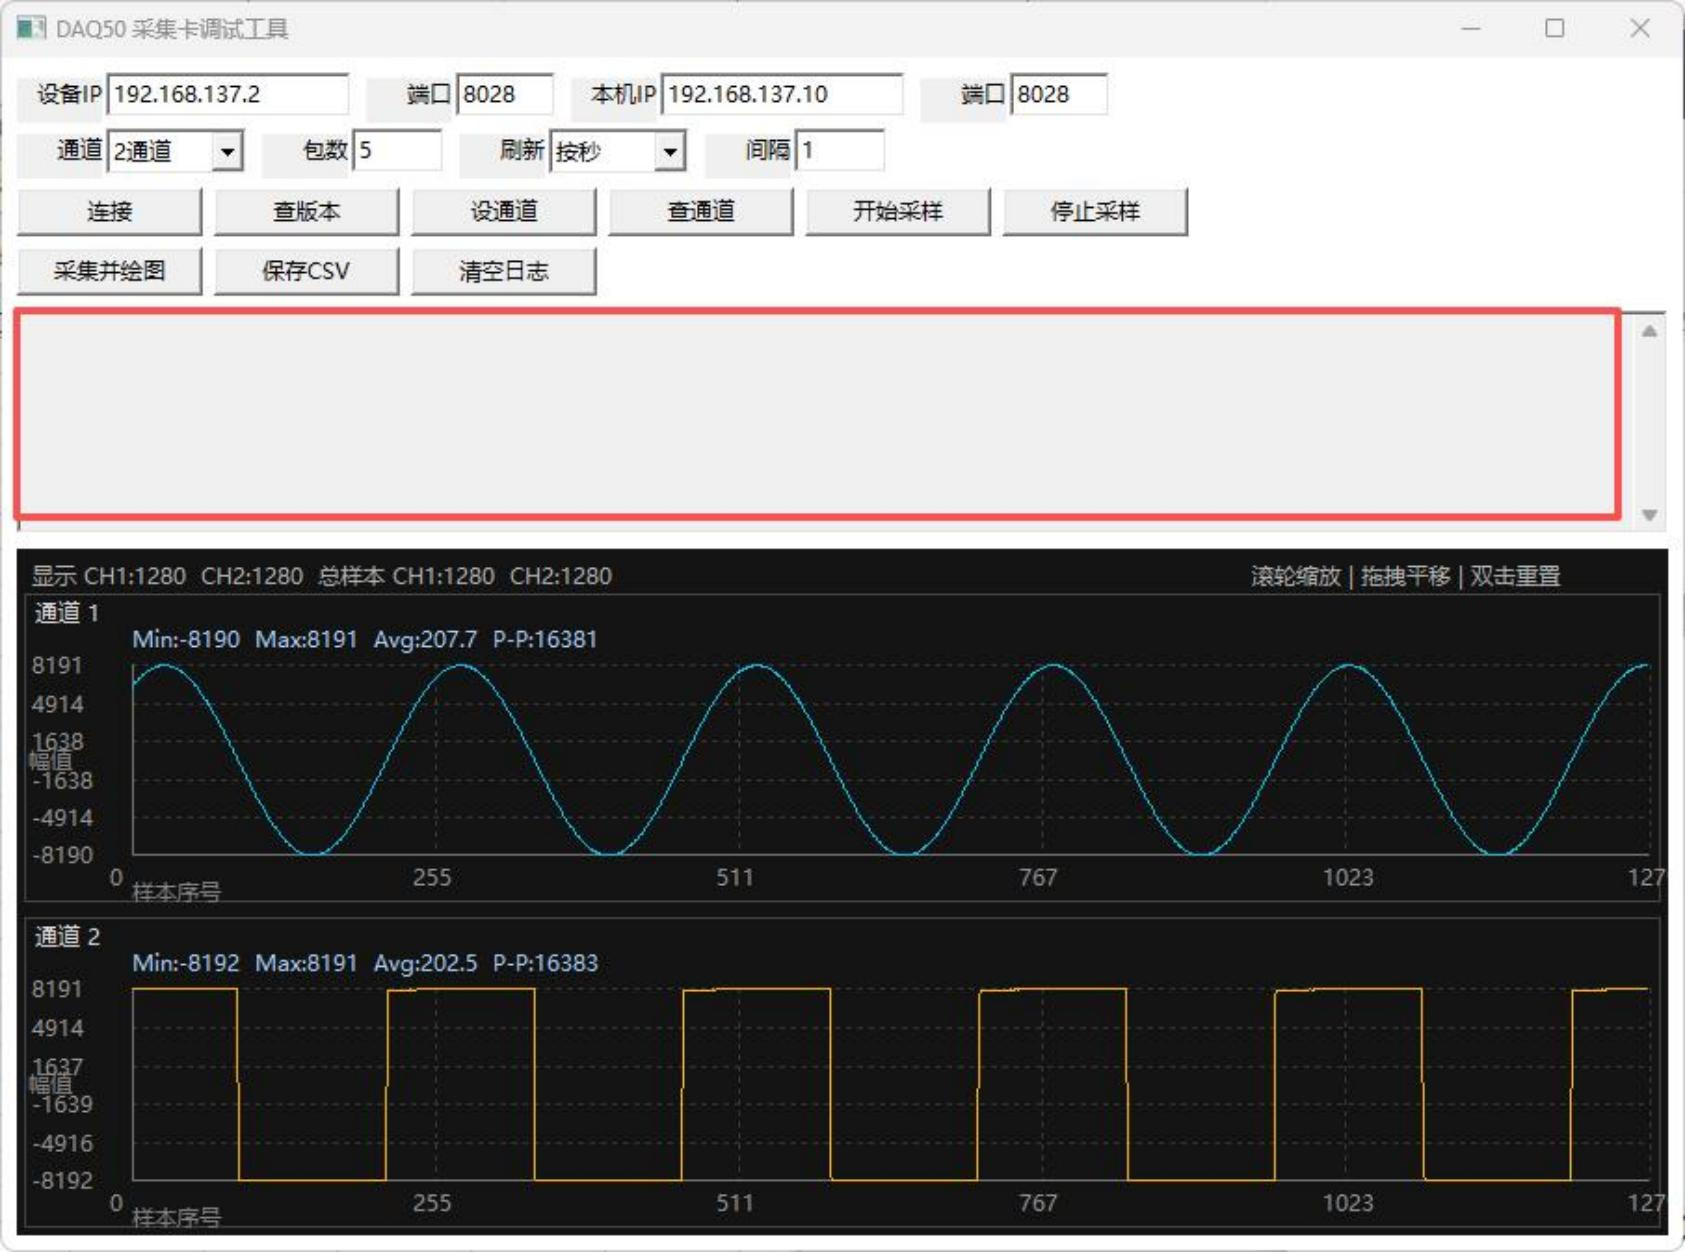
2. Double-click to open the software “DAQ50 采集卡调试工具.exe,” set the device IP to 192.168.137.2 and the port to 8028, and set your local IP to 192.168.137.10 and the port to 8028, as shown in the figure below:
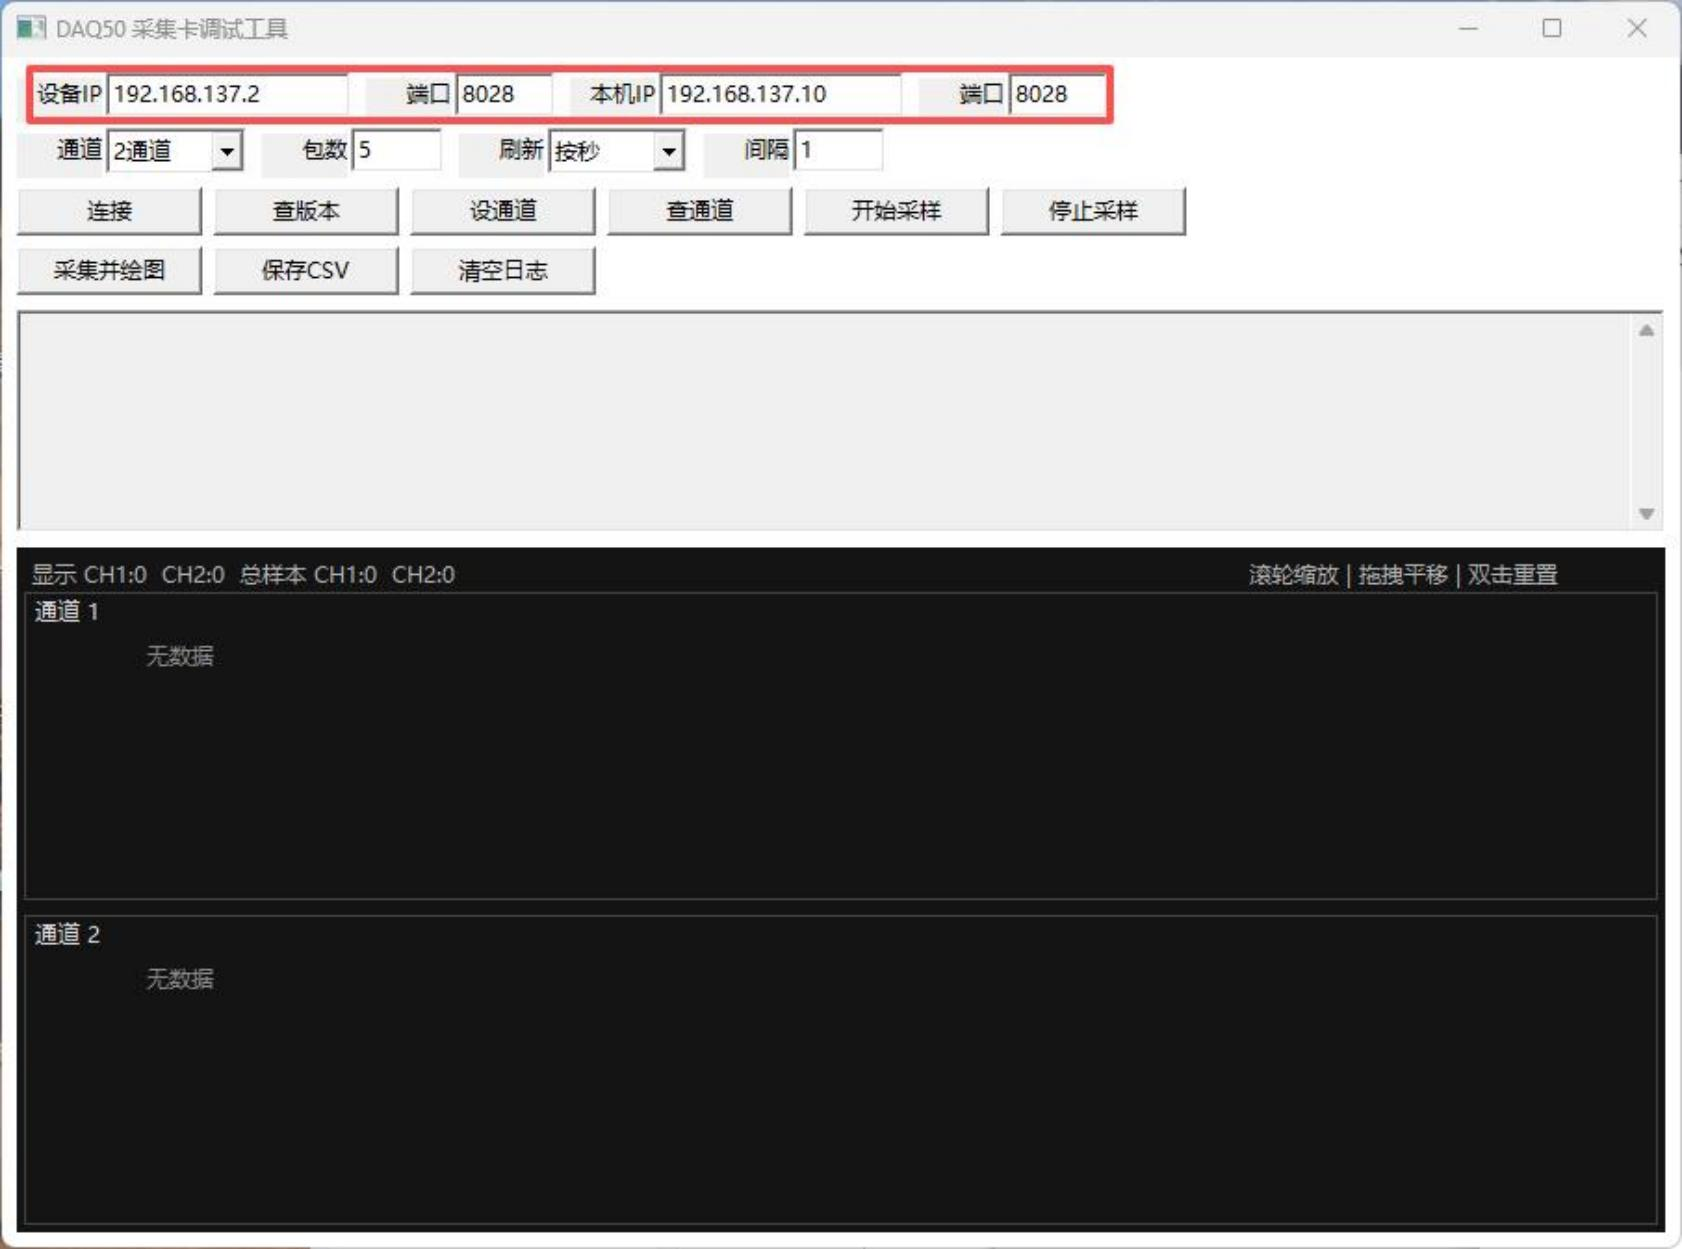
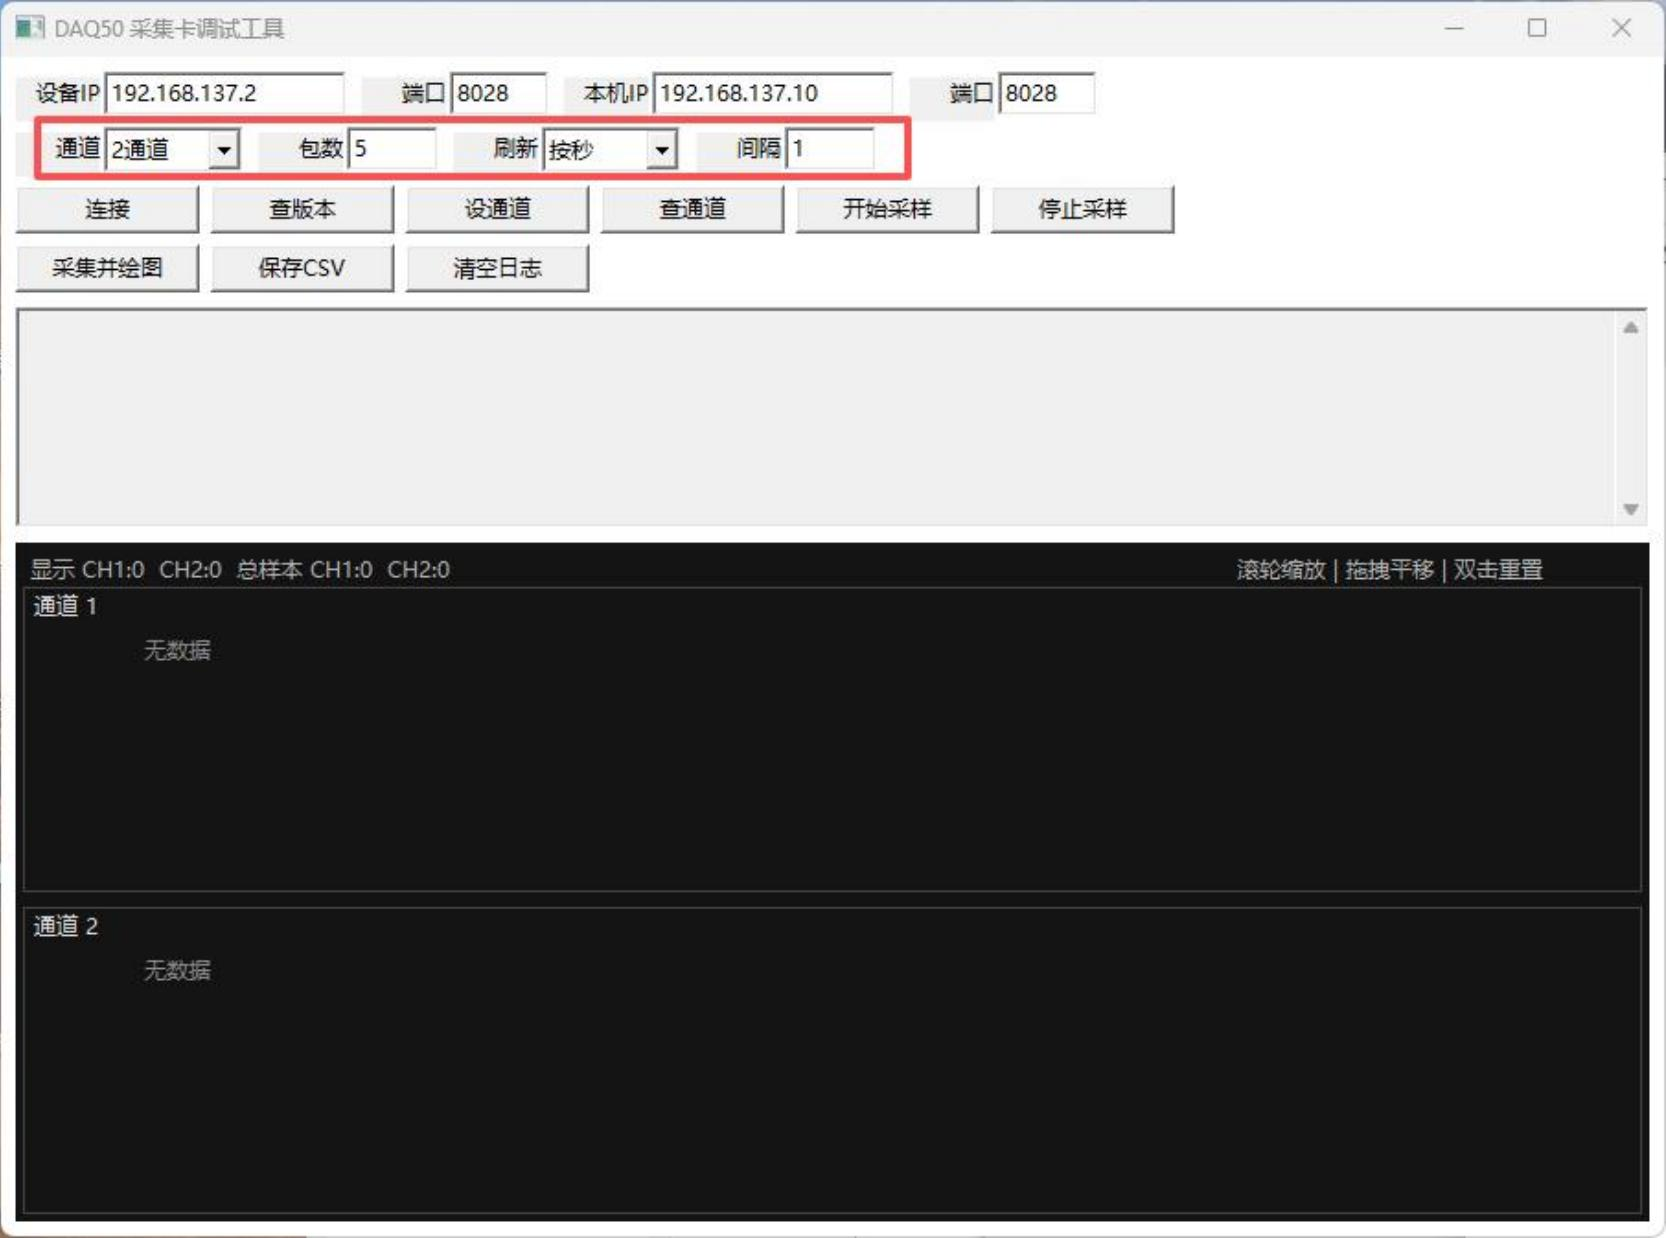
3. Select the number of ADC channels on the acquisition card (1 channel or 2 channels), set the “Number of Packets” (0 = continuous acquisition)—where 1 packet equals 512 samples—set the refresh mode (options include refreshing by second or by number of packets), and set the interval. Example: For 2-channel data acquisition, with “Number of Packets” set to 5, “Refresh” set to “By Second,” and “Interval” set to 1 second, the display will appear as shown in the figure below: (“Refresh” and “Interval” are only effective during continuous acquisition.)
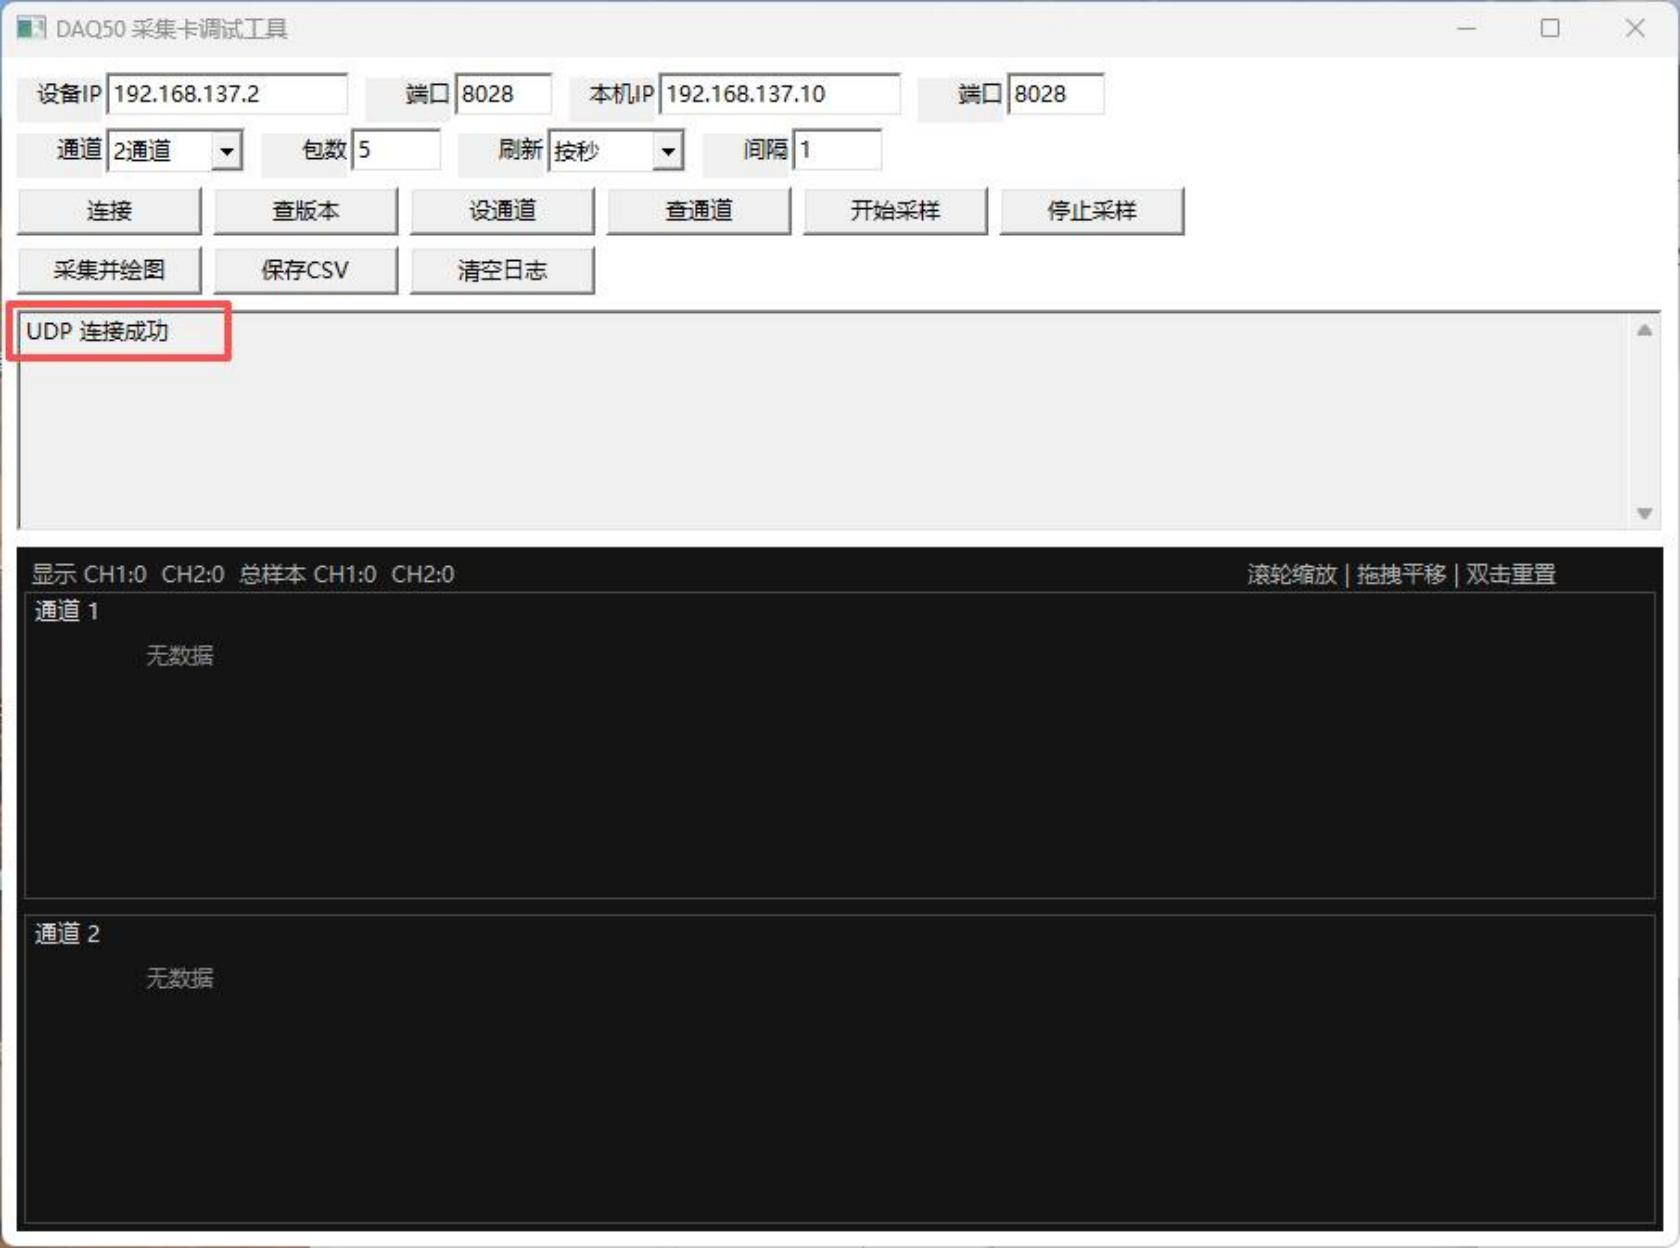
4. Click “Connect.” If the message “UDP connection successful” appears, as shown in the figure below, the connection was successful.
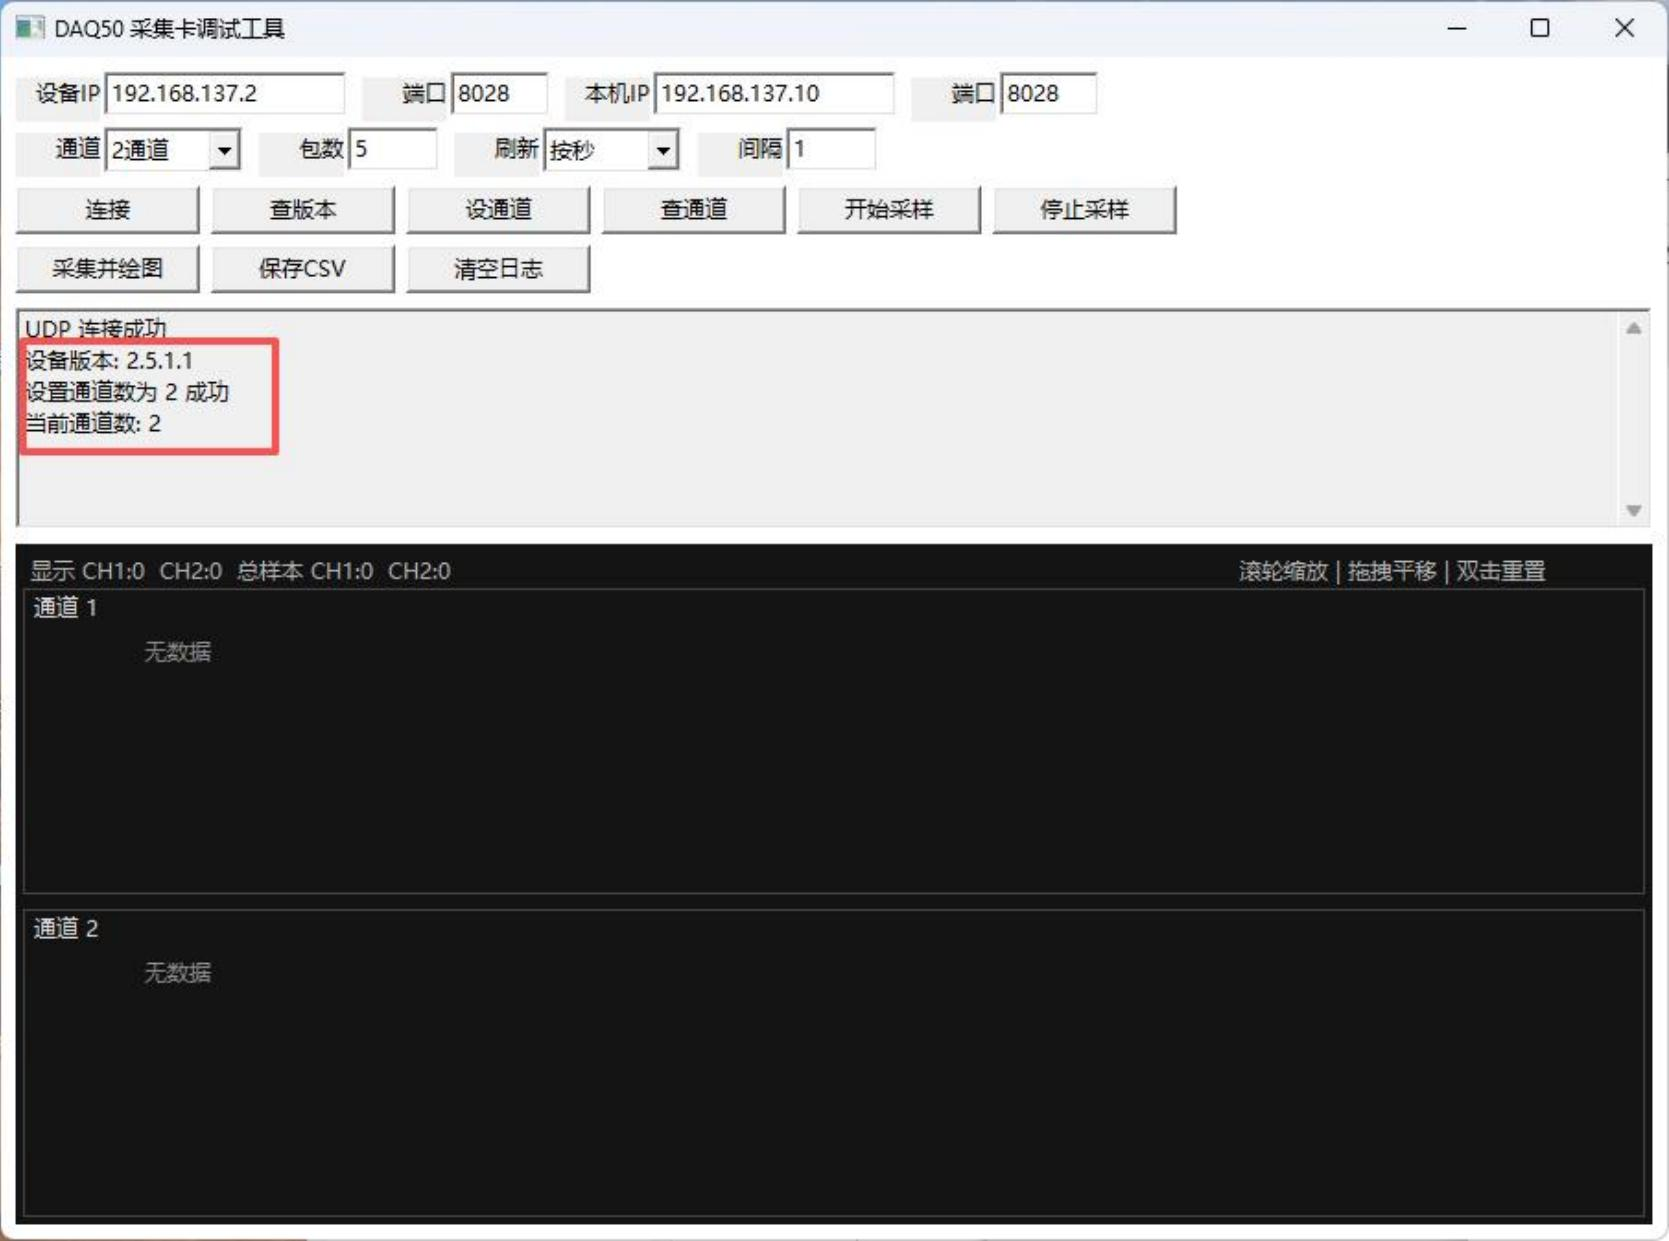
5. Click “Check Version” to view the device version number, click “Set Channel” to apply the channel settings selected in Step 3, and click “Check Channels” to view the current number of channels. The display is shown in the figure below:
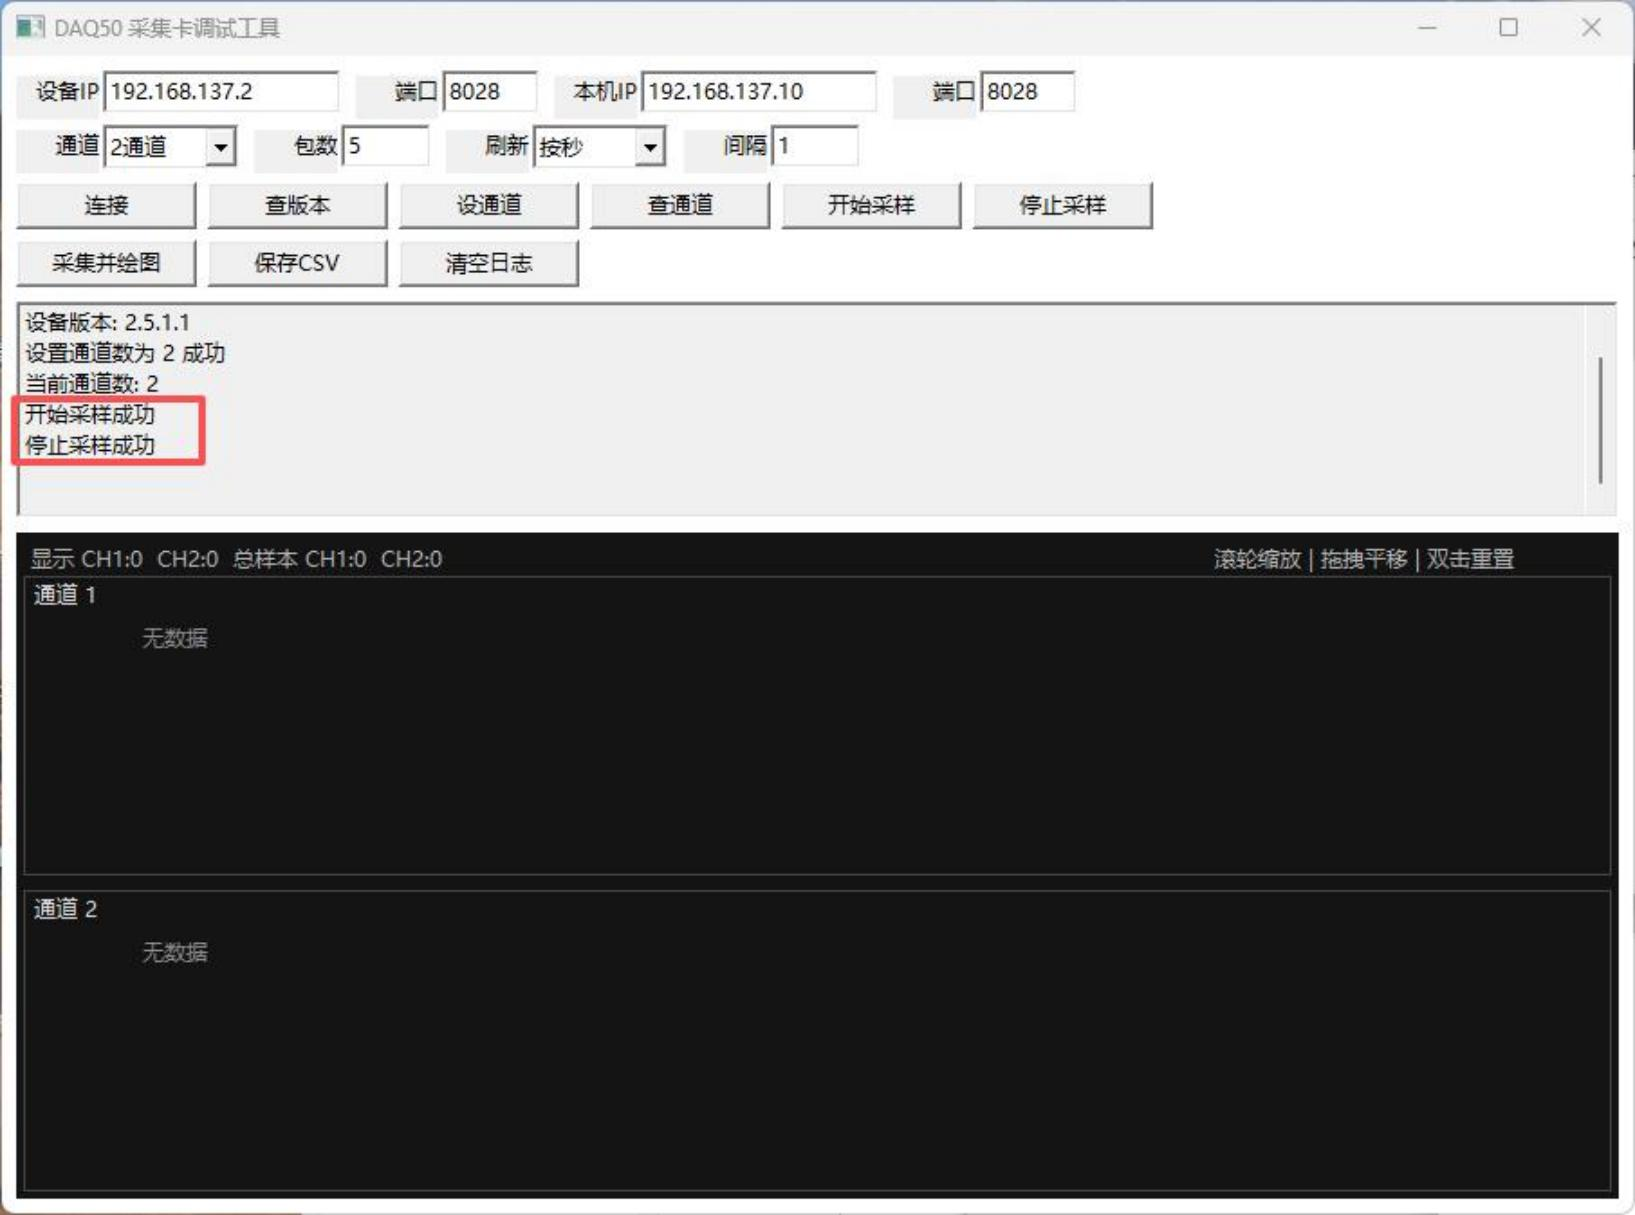
6. Click “Start Sampling” to begin collecting data; the “Log” column will display “Start Sampling Successful.” Click “Stop
Sampling” to stop collecting data; the “Log” column will display “Stop Sampling Successful.” As shown in the figure below:
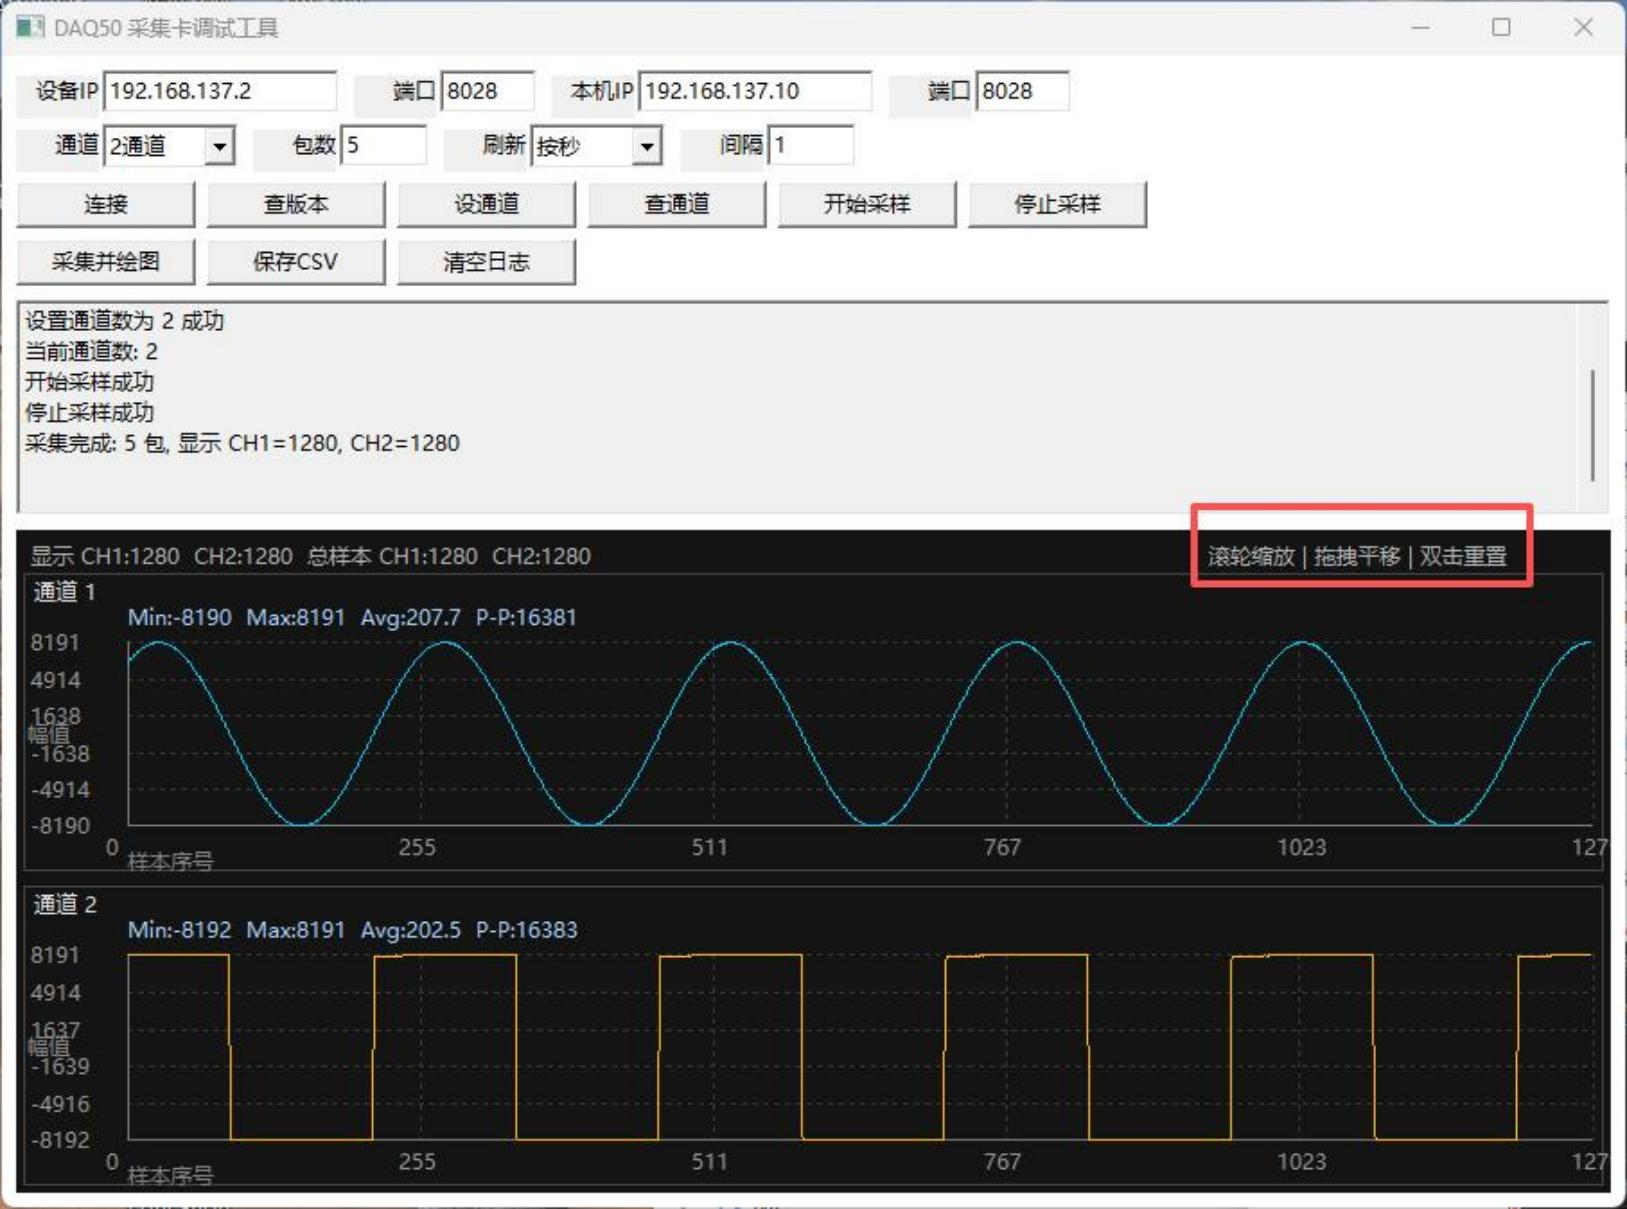
7. Click “Acquire and Plot” to acquire data and display it on the screen (if “Number of Packets” is set to 0, indicating “Continuous Acquisition” mode, data will continue to be acquired after clicking “Acquire and Plot”; you must click “Stop Acquisition” to stop data acquisition). To examine the specific details of the signal waveform, use the zoom in and out controls shown in the red box in the upper-right corner of the figure below.
8. Click “Save CSV” to save the data displayed in the image to the location of your choice in Excel format.
9. Click “Clear Log” to clear the log interface within the red box in the software. After clearing the interface, it will look as shown in the figure below: