How to demodulate data from a distributed fiber optic vibration system
Some users are just starting their research on the related aspects of distributed fiber optic vibration DVS, because they do not have the experimental equipment for DVS at hand, or just want to know in advance what kind of data format this fiber optic sensing system comes out.
We have a complete solution for the hardware components of a distributed fiber optic vibration monitoring system.Therefore, for data acquisition, we also provide corresponding products, for DVS products, we have 100M, 250M or even 1 G capture card. Usually we recommend our customers to use a 100M sampling rate acquisition card to implement a distributed fiber optic vibration monitoring system (DVS).
Product link for DVS dedicated data acquisition card: https://www.ybphotonics.com/product/25
This is a PCIe x8 interface data acquisition card, so we need a PCIe x8 or PCIe x16 slot on the host computer to install it.After installation, we need to install the driver for windows platform (this data acquisition card only supports windows platform). After installing the driver, we can call the packaged dynamic link library (.dll file) through programming language (C++, Python, etc.) to collect data.
The programming logic and function call flow of the program is as follows
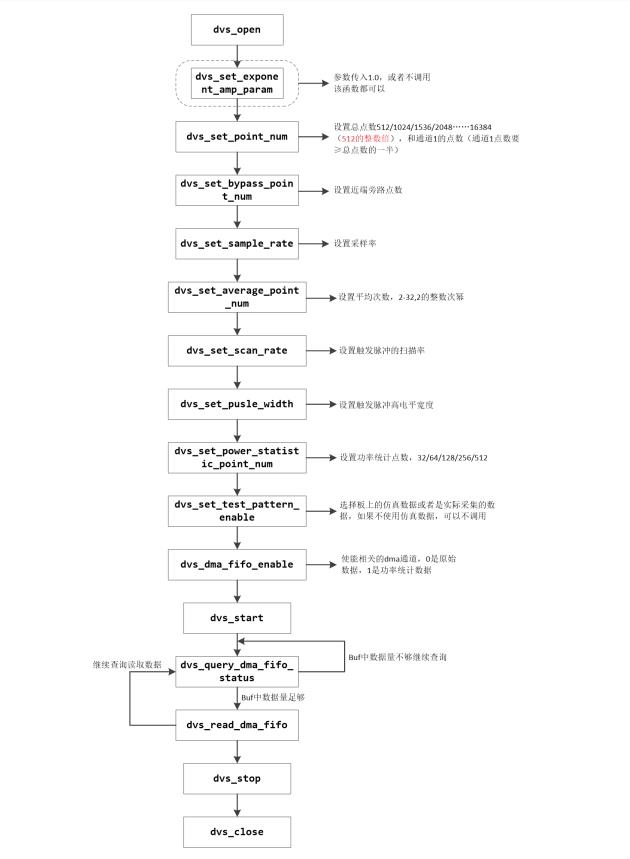
Sampling parameters and data format:
pulse width: 100ns
pulse frequency: 2000Hz
sample points: 150
format:uint16
struct: mxn,m=150,n=158880
|11|12|13|¡|1n-1|1n|
|21|22|23|¡|2n-1|2n|
¡
|m1|m2|m3|¡|mn-1|mn|
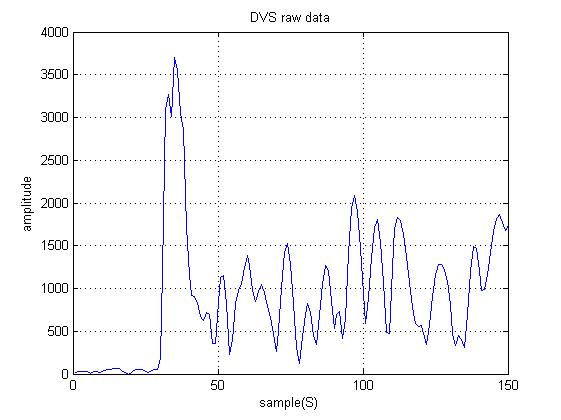
Vibration position: 104
After the above sampling parameters and sampling process function calls, we can get the raw vibration data.
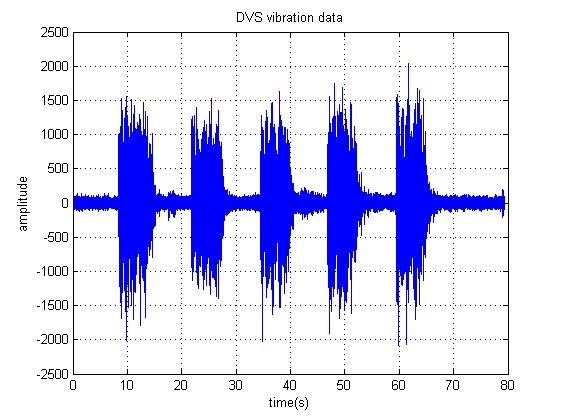
We take the vibration data of a certain point and plot it as a graph with the horizontal coordinate as the time axis and the vertical coordinate as the vibration amplitude.
After the differential demodulation, we can obtain the vibration profile.
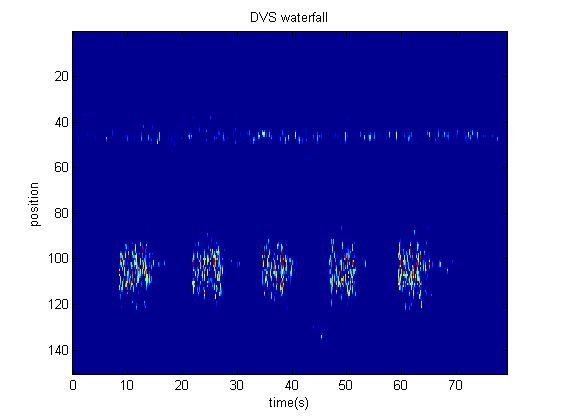
According to the vibration graph to obtain the strong and weak signals, we can plot the spectrum as follows.
Related Contents